1). What is continuity? What is discontinuity?
- Continuity in Calculus basically means that a graph is continuous which means that the graph has 4 characteristics: 1). the graph can be predicted, 2). the graph contains no breaks, no holes, no jumps, and no oscillating behavior, 3). the value and the limit must be the same, and 4). the graph must be able to be drawn without the lifting of the pencil from the paper.
 |
| An example of a continuous graph with all 4 characteristics of continuity http://www.hyper-ad.com/tutoring/math/calculus/Derivatives.html |
- Discontinuity in Calculus is, consequently, something that that causes a graph to be discontinuous. There are 4 types of discontinuities, which are divided into 2 families, these being Removable and Non-Removable.Removable discontinuities include point discontinuities, which are essentially just holes. Non-Removable include jump discontinuities, which cause breaks in the graph, infinite discontinuities, which result in unbounding behavior, and oscillating behavior, which creates unpredictable, random "wiggly lines".
  |
| A point discontinuity, creating a hole http://www.wyzant.com/resources/lessons/math/calculus/limits/continuity |
 |
| A jump discontinuity resulting in a break in the graph http://en.wikipedia.org/wiki/Classification_of_discontinuities |
 |
| A vertical asymptote causes an infinite discontinuity http://www.emathematics.net/continuity.php?def=discont |

 |
| Oscillating behavior causing discontinuity http://web.cs.du.edu/~rjudd/calculus/calc1/notes/discontinuities/ |
2). What is a limit? When does a limit exist? When does a limit not exist? What is the difference between a limit and a value?
- A Limit is the intended height of a function.A limit EXISTS when the specific interval of the graph where the limit is located is CONTINUOUS. In other words, if a limit is located at a part of the graph that has all 4 characteristics of a continuous function, then the limit will exist. The reason behind this is that only when a graph is continuous does the graph have a consistent intended height; when a graph is discontinuous it has certain abnormalities that cause the intended height to be inconsistent and undefinable.
- A limit, however, does not exist when the intended height of a function is unclear or inconsistent due to the presence of any of the three Non-Removable discontinuities.There are 3 specific cases of this happening. In the first case, the graph as it approaches the limit shows different left and right behavior, meaning that as the graph is getting to the limit from the left and from the right two different locations are reached and thus two different intended heights are apparent and thus a single limit does not exist. This is because of a jump discontinuity.In case 2, the graph may exhibit unbounded behavior due to an infinite discontinuity due to a vertical asymptote. This results in the graph to go in unbounded directions, and as a result the limit will never exist where the asymptote is because a limit can never intend to reach a height of infinity. Thirdly, if there is oscillating behavior, the graph is so unpredictable that a graph has no real intended height.
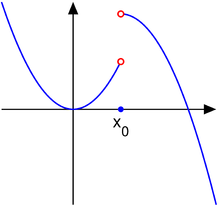
- It is important to discern between a value and a limit. A value is the actual height of a function whereas a limit is the intended height. Sometimes these are both the same thing, but a lot of other times they are not. For instance, in the case of a hole, the limit is at the hole, but there is no value at a hole. On the other hand, there can be a value but no limit, such as the case in the jump discontinuity below:

 |
| The value is at the closed circle, however at that same value of x, there is no limit because of different left and right behavior due to the jump. http://commons.wikimedia.org/wiki/File:Jump_discontinuity_cadlag.svg 3). How do we evaluate limits numerically, algebraically, and graphically?
Sources:
http://www.hyper-ad.com/tutoring/math/calculus/Derivatives.html - the first image
http://www.wyzant.com/resources/lessons/math/calculus/limits/continuity - second image
http://en.wikipedia.org/wiki/Classification_of_discontinuities - 3rd http://www.emathematics.net/continuity.php?def=discont - 4th http://web.cs.du.edu/~rjudd/calculus/calc1/notes/discontinuities/ - 5th http://commons.wikimedia.org/wiki/File:Jump_discontinuity_cadlag.svg - 6th |
Please ignore the double images, some technical difficulties have occurred and, out of concern of collapse of the project, the members of the board of Michael have decided it best to leave the anomaly untreated.
ReplyDelete